Category Archives: Data

Is “data” singular or plural?

I’m a stickler for the plural.  (Peer reviewers are, too.) What’s your take?

Grammar Party

Man with laptop. Word bubble says: Hey, girl. Let's check out some data together

Buckle up, folks. People have strong feelings about whether to treat “data” as a singular or plural noun. And we are going to talk all about it today.

Technically, “datum” is the singular version, and “data” is the plural version.

This means—technically—“data” takes a plural version of a verb.

Examples:

The data are correct.
The data show these numbers.
The data illustrate the findings.

But . . . these days, most people treat “data” as if it were singular. So they use a singular verb with it.

Examples:

The data is correct.
The data shows these numbers.
The data illustrates the findings.

This is where you have to make a decision. Are you going to be a stickler and fight for “data” as a plural, or are you going to buckle under peer pressure and treat it as singular?

You are entitled to your own thoughts about this. But guess…

View original post 155 more words

Is History “Bunk”? We report. You Decide.

History?  Really?  Fascinating!  Ever thought about all the stories behind your own present life?

Check out this youtube dramatized documentary about Nurse Mary Seacole.  I promise – you’ll enjoy: https://www.youtube.com/watch?v=RIrim4r-LbY   

You can be a part of documenting such stories, including your own.  Can I pique your interest with these examples about historical research?

1. Artifacts: Example = http://acif.org/ The American Collectors of Infant Feeders:

Infant feeder
CREDIT http://acif.org/

The American Collectors of Infant Feeders is a non-profit organization whose primary purpose is to gather and publish information pertaining to the feeding of infants throughout history. The collecting of infant feeders and related items is promoted.

2. Interviews: Example = http://www.oralhistory.org/  Want to do interviews of interesting faculty, students, leaders, “ordinary” nurses?  Check out the Oral History Association    In addition to fostering communication among its members, the OHA encourages standards of excellence in the collection, preservation, dissemination and uses of oral testimony.

scrapbook
CREDIT https://archives.mc.duke.edu/blog/nursing-materials-displa

3. Stories from the “ordinary: Example: http://www.murphsplace.com/mother/main.html My Mother’s War – “Helen T.Burrey was an American nurse who served as a Red Cross Nurse during World War I. She documented her experience in both a journal and a scrapbook which has been treasured by her daughter, Mary Murphy. Ms Murphy has placed many of these items on the Internet for people to access and it provides a first-hand account of that experience. Additionally she has a variety of links to other WWI resources.” (quoted from AAHN Resources online)

Army history
CREDIT http://e-anca.org/

4. Ethnic studies: Example=https://libguides.rowan.edu/blacknurses  Black Nurses in History “This is a ‘bibliography and guide to web resources’ from the UMDNJ and Coriell Research Library. Included are Mamie O. Hail, Mary Eliza Mahoney, Jessie Sleet Scales, Mary Seacole, Mabel Keaton Staupers, Susie King Taylor, Sojourner Truth, Harriet Tubman.” (quoted from AAHN Resources online)

Want more?  

Critical thinking:  Don’t forget to save your own materials.  Your life is history!  What in your life is most interesting?  Have you written it down or dictated it into your iphone voice memo? There is GREAT interest in “ordinary” men and women.  Many times items are tossed because they are “just letters” or “only old records,” or “stuff.” Just Don’t Do It.


More? Not always better! Check out NNT.

EBP
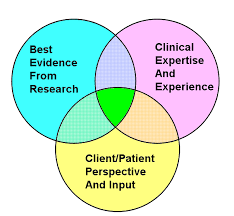
Practice based in evidence (EBP) means that you must critique/synthesize evidence and then apply it to particular setting and populations using your best judgement.  This means that you must discriminate about when (and when NOT) to apply the research.  Be sure to use best professional judgment to particularize your actions to the situation!

Add to your repertoire of EBP tools,  ratiothe Number Needed to Treat (NNT).   This is not mumbo -jumbo.   NNT explained here–short & sweet: http://www.thennt.com/thennt-explained/ 

FindingsCRITICAL THINKING:   Check out this or other analyses at the site.  How does the info on antihypertensives for mild hypertension answer the question of whether more is better?  Are there patients in whom you SHOULD treat mild HTN?  (“We report, you decide.”)   http://www.thennt.com/nnt/anti-hypertensives-for-cardiovascular-prevention-in-mild-hypertension/

MORE INFO:  Check out what the data say about other risk/benefit treatments at http://www.thennt.com/ 

Goldilocks and the 3 Levels of Data

Actually when it comes to quantitative data, there are 4 levels, but who’s counting? (Besides Goldilocks.)

  1. Nominal  (categorical) data are names or categories: (gender, religious affiliation, days of the week, yes or no, and so on)
  2. Ordinal data are like the pain scale.  Each number is higher (or lower) than the next but the distances between numbers are not equal.  In others words 4 is not necessarily twice as much as 2; and 5 is not half of 10.
  3. Interval data are like degrees on a thermometer.  Equal distance between them, but no actual “0”.  0 degrees is just really, really cold.
  4. Ratio data are those  with real 0 and equal intervals (e.g., weight, annual salary, mg.)

(Of course if you want to collect QUALitative word data, that’s closest to categorical/nominal, but you don’t count ANYTHING.  More on that another time.)

CRITICAL THINKING:   Where are the levels in Goldilocks and the 3 levels of data at this link:  https://son.rochester.edu/research/research-fables/goldilocks.html ?? Would you measure soup, bed, chairs, bears, or other things differently?  Why was the baby bear screaming in fright?

Nightingale: Avant garde in meaningful data

In honor of Nurse Week, I offer this tribute to the avant garde research work of Florence Nightingale in the Crimea that saved lives and set a precedent worth following.

Nightingale was a “passionate statistician” knowing that outcome data are convincing when one wants to change the world.  She did not merely collect the data, but also documented it in a way that revealed its critical meaning for care.

As noted by John H. Lienhard (1998-2002): Nightingale coxcombchart“Once you see Nightingale’s graph, the terrible picture is clear. The Russians were a minor enemy. The real enemies were cholera, typhus, and dysentery. Once the military looked at that eloquent graph, the modern army hospital system was inevitable.  You and I are shown graphs every day. Some are honest; many are misleading….So you and I could use a Florence Nightingale today, as we drown in more undifferentiated data than anyone could’ve imagined during the Crimean War.” (Source: Leinhard, 1998-2002)

As McDonald (2001) writes in the BMJ free, full-text,  Nightingale was “a systemic thinker and a “passionate statistician.”  She insisted on improving care by making policy & care decisions based on “the best available government statistics and expertise, and the collection of new material where the existing stock was inadequate.”(p.68)

Moreover, her display of the data brought its message home through visual clarity!

Thus while Nightingale adhered to some well-accepted, but mistaken, scientific theories of the time (e.g., miasma) her work was superb and scientific in the best sense of the word.   We could all learn from Florence.

CRITICAL THINKING:   What issue in your own practice could be solved by more data?  How could you collect that data?   If you have data already, how can you display it so that it it meaningful to others and “brings the point home”?

FOR MORE INFO:

HAPPY NURSE WEEK TO ALL MY COLLEAGUES.  

MAY YOU GO WHERE THE DATA TAKES YOU!

Listen up! Don’t interrupt!

Researchers collect two types of data in their studiescounting-sheetword-art

  1. Numbers (called quantitative data)
  2. Words & narratives (called qualitative data)

StorytellerOne source of rich word or narrative (qualitative) data for answering nursing questions is nurses’ stories.  Dr. Pat Benner RN, author of Novice to Expert explains two things we can do to help nurses fully tell their stories so we can learn the most from their practice.

  1. Listen well without interrupting
  2. Help nurses ‘unpack’ their stories 

Check out this excellent 2:59 video of Dr. Benner’s and revolutionize how you learn about nursing from nursing stories:  Preview: The use of Narratives 

Critical thinking:  For a study using narratives in research see  Leboul et al. (2017).  Palliative sedation challenging the professional competency of health care providers and staff: A qualitative focus group and personal written narrative study.  [full text available thru PubMed at https://www.ncbi.nlm.nih.gov/pubmed/28399846].    1) Do you think the authors listened and unpacked information from the focus groups & written narratives; 2)  Do you think there might be a difference in the way people write narratives and verbally tell narratives?   3) How might that difference if any affect the research findings?

For more information:  Check out The Power of Story  by Wang & Geale (2015) at http://www.sciencedirect.com/science/article/pii/S2352013215000496


Direct speaking about INdirect outcomes: HCAHPS as a measurement

When you first plan a project, you need to know what OUTCOMES you want to achieve.  You need STRONG outcomes to show your project worked! imagesCALQ0QK9

Outcome measures are tricky & can be categorized into Indirect & Direct measures:

  1. INDIRECT outcome measures are often affected by many factors, not just your innovation
  2. DIRECT outcome measures are specific to what you are trying to accomplish.

For example: If you want to know your patient’s weight, you put them on the scale (direct). weight-scaleYou don’t merely ask them how much they weigh (indirect).

Another example?  If you planned music to reduce pain, you might a) measure how many patients were already using music and their pain scores (& perhaps those not using music and their pain scores), b) begin your music intervention, and c) thmusicen directly measure how many patients started using it after you started your intervention and their pain scores.  These data DIRECTLY target your inpatient outcomes versus looking at INDIRECT HCAHPS answers of discharged patients’ feelings after the fact in response to “During this hospital stay, how often was your pain well controlled?”

Nurses often decide to measure their project outcomes ONLY with indirect HCAHPS scores.  I hope you can see this is not as good as DIRECT measures.

So why use HCAHPS at all?measuring-tape

  • They reflect institutional priorities related to quality and reimbursement
  • Data are already collected for you
  • Data are available for BEFORE and AFTER comparisons of your project outcomes
  • It doesn’t cost you any additional time or money to get the data

Disadvantages of indirect HCAHPS measures?

  • HCAHPS data are indirect measures that are affected by lots of different things, and so they may have little to do with effect of your project.
  • HCAHPS responders often do Not represent all patients because the number responding is so small–sometimes just 1 or 2

Still, I think it’s good to include HCAHPS.  Just don’t limit yourself to that. Include also a DIRECT measure of outcomethat targets the precisely what you hope will be the result of your study.

imagesCALQ0QK9You need STRONG outcomes to convince others that your project works to improve care!

CRITICAL THINKING:  McClelland, L.E., &  Vogus, T.J. (2014) used HCHAPS as an outcome measure in their study, Compassion practices & HCAHPS: Does rewarding and supporting questionworkplace compassion influence patient perceptions?    What were the strengths & weaknesses of using HCHAPS in this study? [hint: check out the discussion section]  What would be a good direct measure that you could add to HCAHPS outcomes to improve the study?

FOR MORE INFORMATION:  Whole books of measurement instruments are available through the library or a librarian can help you search for something that will measure motivation, pain, anxiety, medication compliance, or whatever it is you are looking for!!  You can limit your own literature searches by selecting “instrument” as part of your search, or you can consult with a nurse researcher for more help.

DATA COLLECTION SECTION! (Methods in the Madness)

Key point! The data collection section of a research article includes: who collects what data when, where & how.

In previous blogs we’ve looked at title, introduction, and other elements of methods section (design, sample, & setting). In this one let’s take a look at data collection.

Data are a collection of measurements. For example, student scores on a classroom test might be 97, 90, 88, 85, & so on. Each single score is a datum; collectively they are data.

What data are collected is answered in this section. The data (or measurements) can be counting-hashmarksnumbers OR words. For example, numbers data might include patient ratings of their pain on a 0-10 scale. An example of word data would asking participants to describe something in words without counting the words or anything else.  For example, word data might include patient descriptions pain in words, like word-art“stabbing,”  “achy,” and so on.  Sometimes a researcher collects both number and word data in the same study to give a more complete description.  You can see how knowing the patient’s pain rating and hearing a description would give you a much clearer picture of pain.

  • Studies reporting data in numbers are called quantitative studies
  • Studies reporting data in words/descriptions are called qualitative studies
  • Studies reporting number & word data are called mixed methods studies

How the data are collected includes what instrument or tool was used to gather data (e.g., observation, biophysical measure, or self-report) and how consistently & accurately that tool measures what it is supposed to measure (e.g., reliability & validity). Also included is who collected the data and the procedures that they followed—how did they obtain consent, interaction with subjects, timing of data collection and so on.

Now you know!

Critical thinking question: Did these authors use qualitative or quantitative data collection methods?  Coelho, A., Parola, V., Escobar-Bravo, M., & Apostolo, J. (2016). Comfort experience in palliative care, BMD Palliative care, 15(71). doi: 10.1186/s12904-016-0145-0.  Explain your answer.

Self-Report Data: “To use or not to use. That is the question.”

[Note: The following was inspired by and benefited from Rob Hoskin’s post at http://www.sciencebrainwaves.com/the-dangers-of-self-report/]Penguins

If you want to know what someone thinks or feels, you ask them, right?

The same is true in research, but it is good to know the pros and cons of using the “self-report method” of collecting data in order to answer a research question.  Most often self-report is done in ‘paper & pencil’ or SurveyMonkey form, but it can be done by interview.

Generally self-report is easy and inexpensive, and sometimes facilitates research that might otherwise be impossible.  To answer well, respondents must be honest, have insight into themselves, and understand the questions.  Self-report is an important tool in much behavioral research.

But, using self-report to answer a research question does have its limits. People may tend to answer in ways that make themselves look good (social desirability bias), agree with whatever is presented (social acquiescence bias), or answer in either extreme terms (extreme response set bias) or always pick the non-commital middle Hypothesisnumbers.  Another problem will occur if the reliability  and validity of the self-report questionnaire is not established.  (Reliability is consistency in measurement and validity is the accuracy of measuring what it purports to measure.) Additionally, self-reports typically provide only a)ordinal level data, such as on a 1-to-5 scale, b) nominal data, such as on a yes/no scale, or c) qualitative descriptions in words without categories or numbers.  (Ordinal data=scores are in order with some numbers higher than others, and nominal data = categories. Statistical calculations are limited for both and not possible for qualitative data unless the researcher counts themes or words that recur.)

Gold_BarsAn example of a self-report measure that we regard as a gold standard for clinical and research data = 0-10 pain scale score.   An example of a self-report measure that might be useful but less preferred is a self-assessment of knowledge (e.g., How strong on a 1-5 scale is your knowledge of arterial blood gas interpretation?)  The use of it for knowledge can be okay as long as everyone understands that it is perceived level of knowledge.

Critical Thinking: What was the research question in this study? Malaria et al. (2016) Pain assessment in elderly with behavioral and psychological symptoms of dementia. Journal of Alzheimer’s Disease as posted on PubMed.gov questionat http://www.ncbi.nlm.nih.gov/pubmed/26757042 with link to full text.  How did the authors use self-report to answer their research question?  Do you see any of the above strengths & weaknesses in their use?

For more information: Be sure to check out Rob Hoskins blog: http://www.sciencebrainwaves.com/the-dangers-of-self-report/


Is a Picture Worth 1,000 words?

Sometimes the best way to answer a research question is to have the participants draw pictures & explain them.  In fact, some have identified art as a powerful communication tool between children and researchers.   The pictures are then analyzed for themes that show up in the drawings.  No numbers or statistics are used.

Methods: When Brady (2009) wondered how children defined a “good nurse,” she asked 22 ethnically diverse, hospitalized girls and boys aged 7-12 years to draw a picture of a good nurse and a bad nurse.  After the children drew their pictures she asked them to tell her what the nurse was wearing and doing.

Results & discussion: What did the pictures say? Drawings and comments suggested that the children focused on these 5 thematic characteristics for a good nurse:  “communication; professional competence; safety; professional appearance; and virtues,” (p.543) such as honesty, listening, kindness, trustworthiness, & being reassuring & fun. 11-year-old Jason communicated some of it in GoodNurse_BadNurse2Figure 4 on page 552.   12-year-old Luke also showed a sharp contrast in Figure 7 on page 556 that is at the top of this blog.  Children valued a reciprocal relationship with their nurses, caring, and safe/professional behavior. Play was one of many things important to them.

Commentary: While the sample is not representative of a larger group and I would question the authors claim to use grounded theory, the study forms the basis for further research.  Additionally these ideas can help us listen more closely to our own pediatric patients.   It would be particularly interesting to compare these 5 themes to how adult patients of various ages describe a good nurse and a bad nurse.

Critical thinking:  How do you think these children’s perspectives compare with the perspectives of your own pediatric patient population?QUESTION

For more information: See Brady, M. (2009). Hospitalized children’s views of the good nurse, Nursing Ethics, 16(5). doi: 10.1177/0969733009106648